In this issue we’ll cover Bitcoin, Crypto, Stocks, & a longer-term opportunity alert.
If you find value, then please share this with others via email or social media. Thank you for your continued support!
Bitcoin
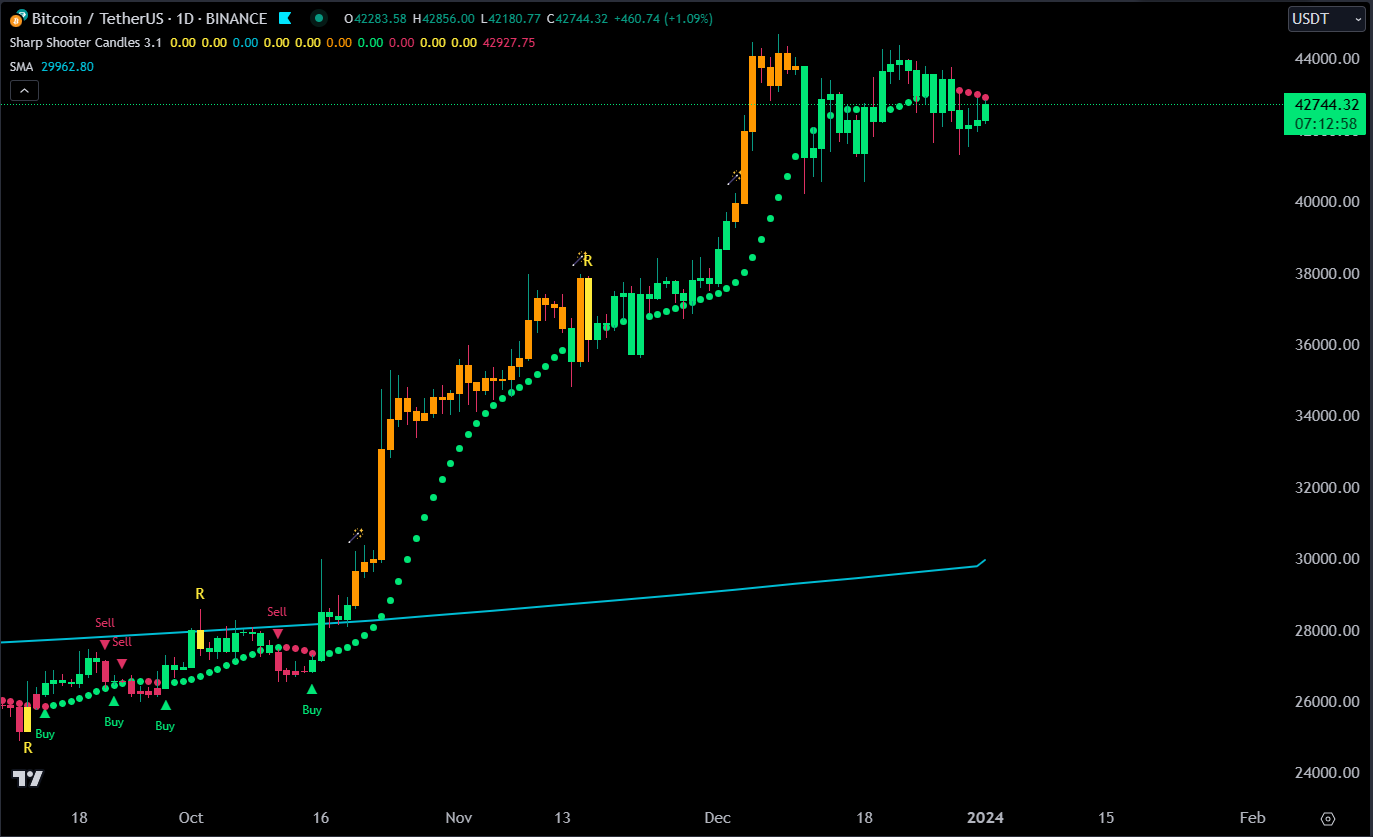
Price nearly hit $44,700 on December 8th and since then price has been consolidating under those 2023 highs. During this consolidation RSI has been slowly decreasing & there have been few pending sell’s but no actual sell signals so we are still at a pivot point.
Three weeks ago we laid out two possible future buy the dip scenarios.
Price would have one last push upwards to hit the 4th target out of 4 longer-term targets mapped out at the bottom of the bear market. Then have a bigger retracement prior to the halving that would present the next buy the dip scenario.
We see a sell signal & price puts in a lower high, retraces to lower targets prior to the halving event, & then another buy the dip scenario prior to the halving.
Weekly chart is still ultra bullish.
Daily chart is still currently bullish.
11 Minute Bitcoin Video Update: 👇
Crypto
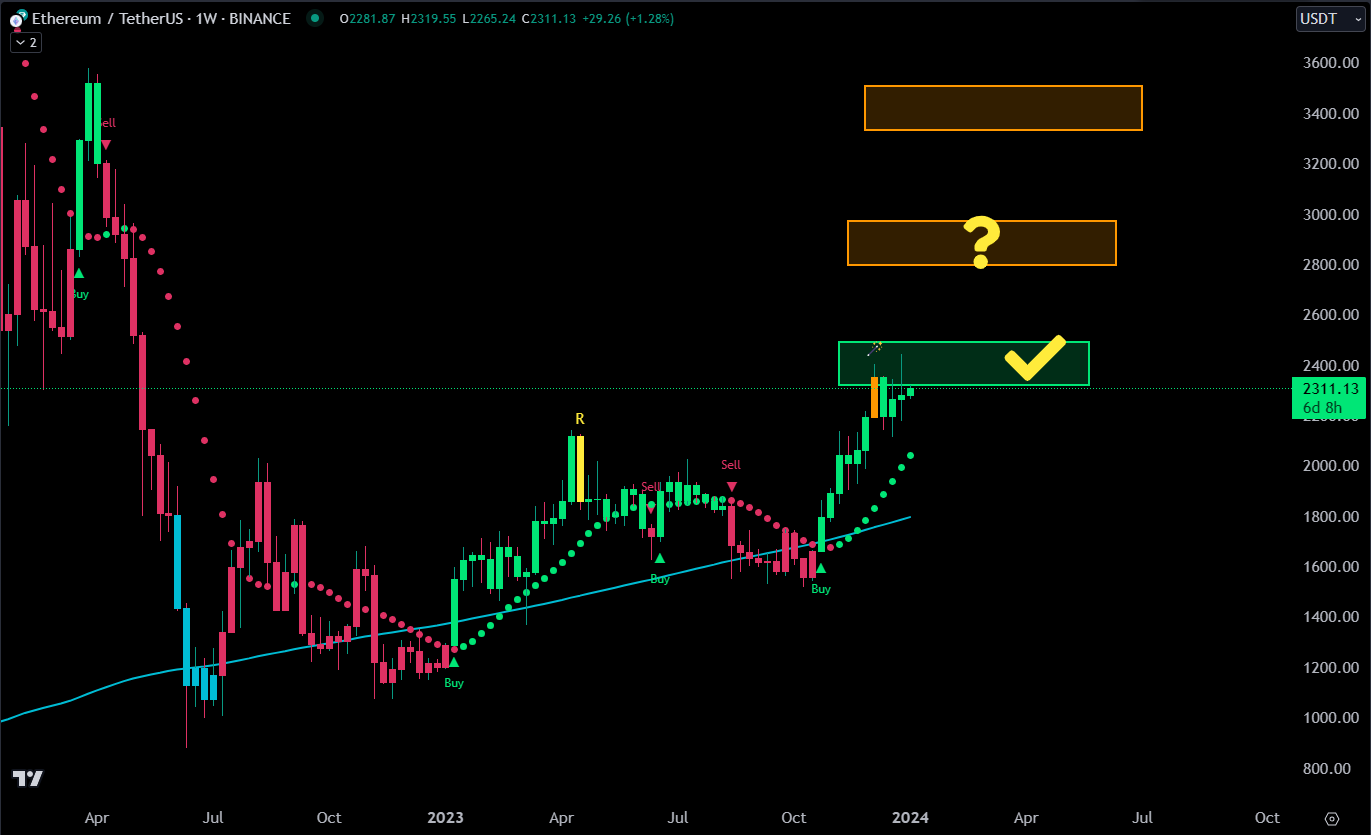
Ethereum hit longer-term price target 2 of 4 just above $2,300 & remains bullish on the weekly & daily chart. However, there continues to be bearish divergence on the daily chart & is something we’ll continue to watch for the next possible buy the dip scenario.
TRB had some fun within 3 day span…Price increased more than +200% followed by a -72% correction. 😅
Stocks
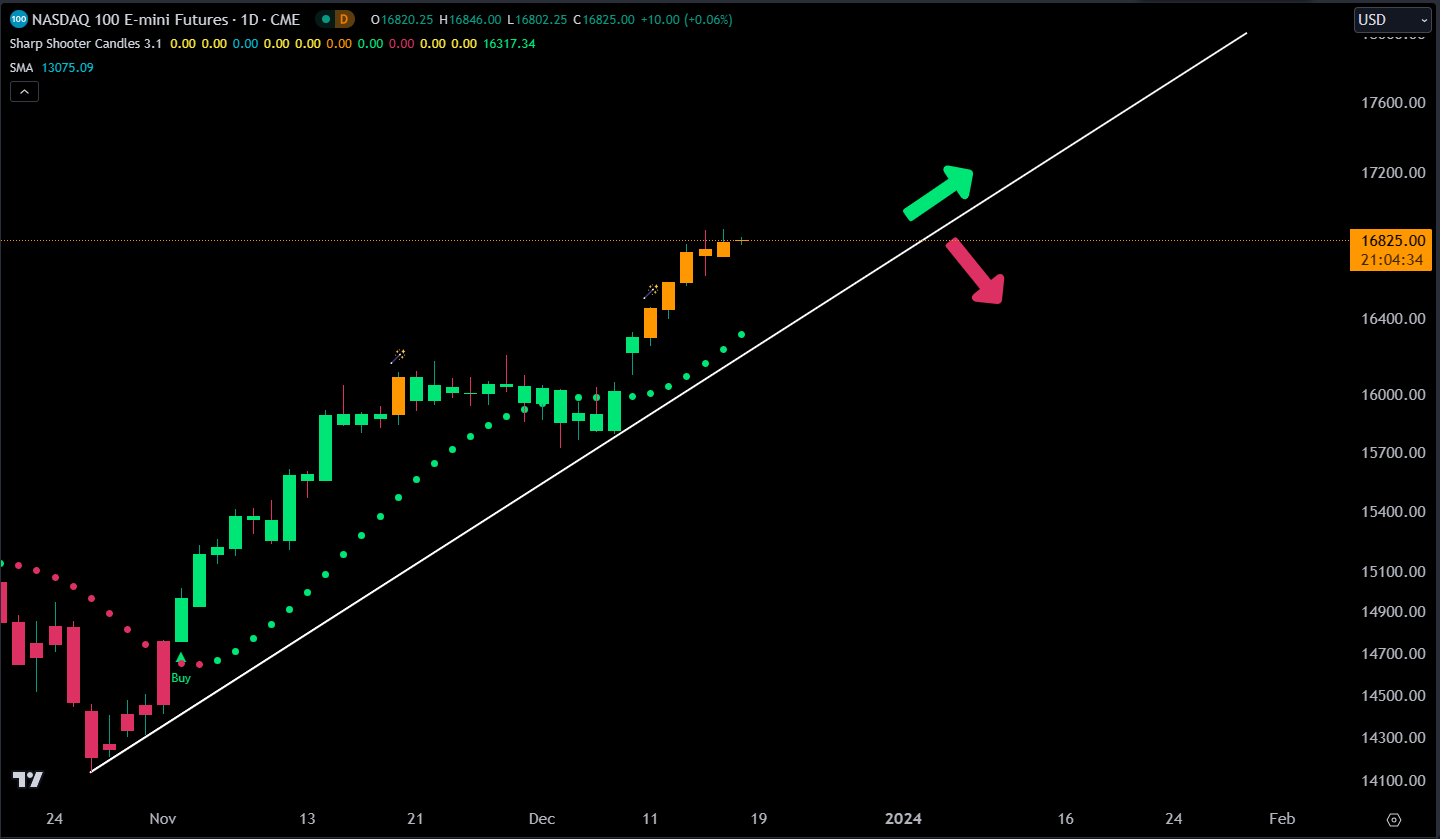
NASDAQ remains bullish on the daily chart & ultra bullish on the weekly chart. Could see a shorter-term pull back due to another sell signal on the 4-hour chart.
Daily Chart Update:
4-hour Chart:
Bearish Divergence
Possible lower high
Sell signal
Retracement for the next buy the dip scenario?
Opportunity Alert:
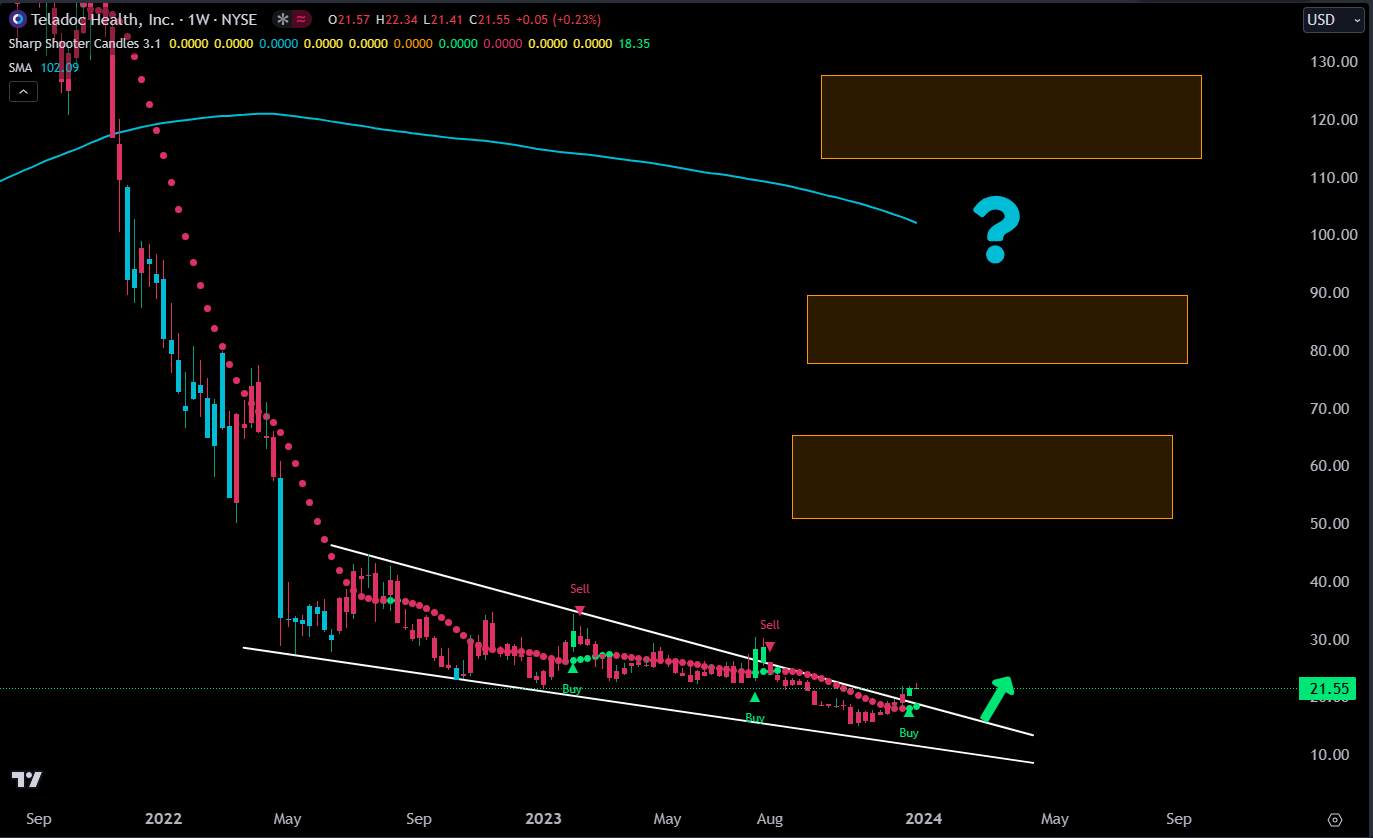
TDOC weekly chart just had a buy signal after hitting a low of $15/share. Possible longer-term buy & hold.
Daily chart is bullish
Weekly chart is bullish
Long-term bullish divergence going back to April 2022
141 week bear market with a -95% correction during that time
Caution:
A more defined higher low on the weekly chart is a higher probability
There could be a pull back on lower time frames prior to price continuing higher
The potential longer-term targets:
Confluence Sniper Targets above $50 & $80
Large Gap at $56
200-week moving average hasn’t been retested since November 2021 & is currently at $102. Other targets as well.
If you love charts, then make sure to follow our posts, videos, & live streams here:
Jesse Olson Twitter (65k)
Jesse Olson Youtube (2k)
Ready to block out the noise? Then join us in the discord here: Market Sniper Website
Disclaimer
The contents of this newsletter are expressed in my opinion only, none of which is financial advice. Always do your own research as this information is intended for educational purposes only.
Any suggestions, comments or questions, please feel free to direct message me on twitter @JesseOlson.
Thanks for reading THE INDICATOR & supporting my work by sharing with others!


